Home
Background
The recent The 30th UN Conference of the Parties (COP30) and Oxfam’s 2025 report shows that the average daily carbon emissions of the world’s richest 0.1% of people have exceeded the total annual emissions of the poorest 50% of people. This phenomenon of “carbon inequality” implies that nearly a decade after the signing of the Paris Agreement in 2015, global efforts to reduce emissions are being eroded by the extremely high emissions of a very small number of people. It is estimated that if global per capita emissions reach the level of these top tycoons, the Earth’s carbon budget will be exhausted within three weeks.
Data shows that although emissions in some developed countries have declined, the global overall emissions have not been significantly reduced since the Paris Agreement. The continuous record-breaking high temperatures are forcing the world to focus on the huge emission gap at the national level and between the rich and the poor.
Dataset Introduction
This dataset is obtained from Global Carbon Budget (2025) in Our World in Data, a scientific publication platform that researches global problems like poverty, disease, and climate change.
The dataset provides comprehensive, country-by-country statistics on annual CO₂ emissions (in tonnes) and related metrics, spanning several decades. For this analysis, the focus will be on per capita CO₂ emissions, a key metric for comparing the carbon intensity of lifestyles and economic activities across nations of different sizes.
Questions
This article aims to explore:
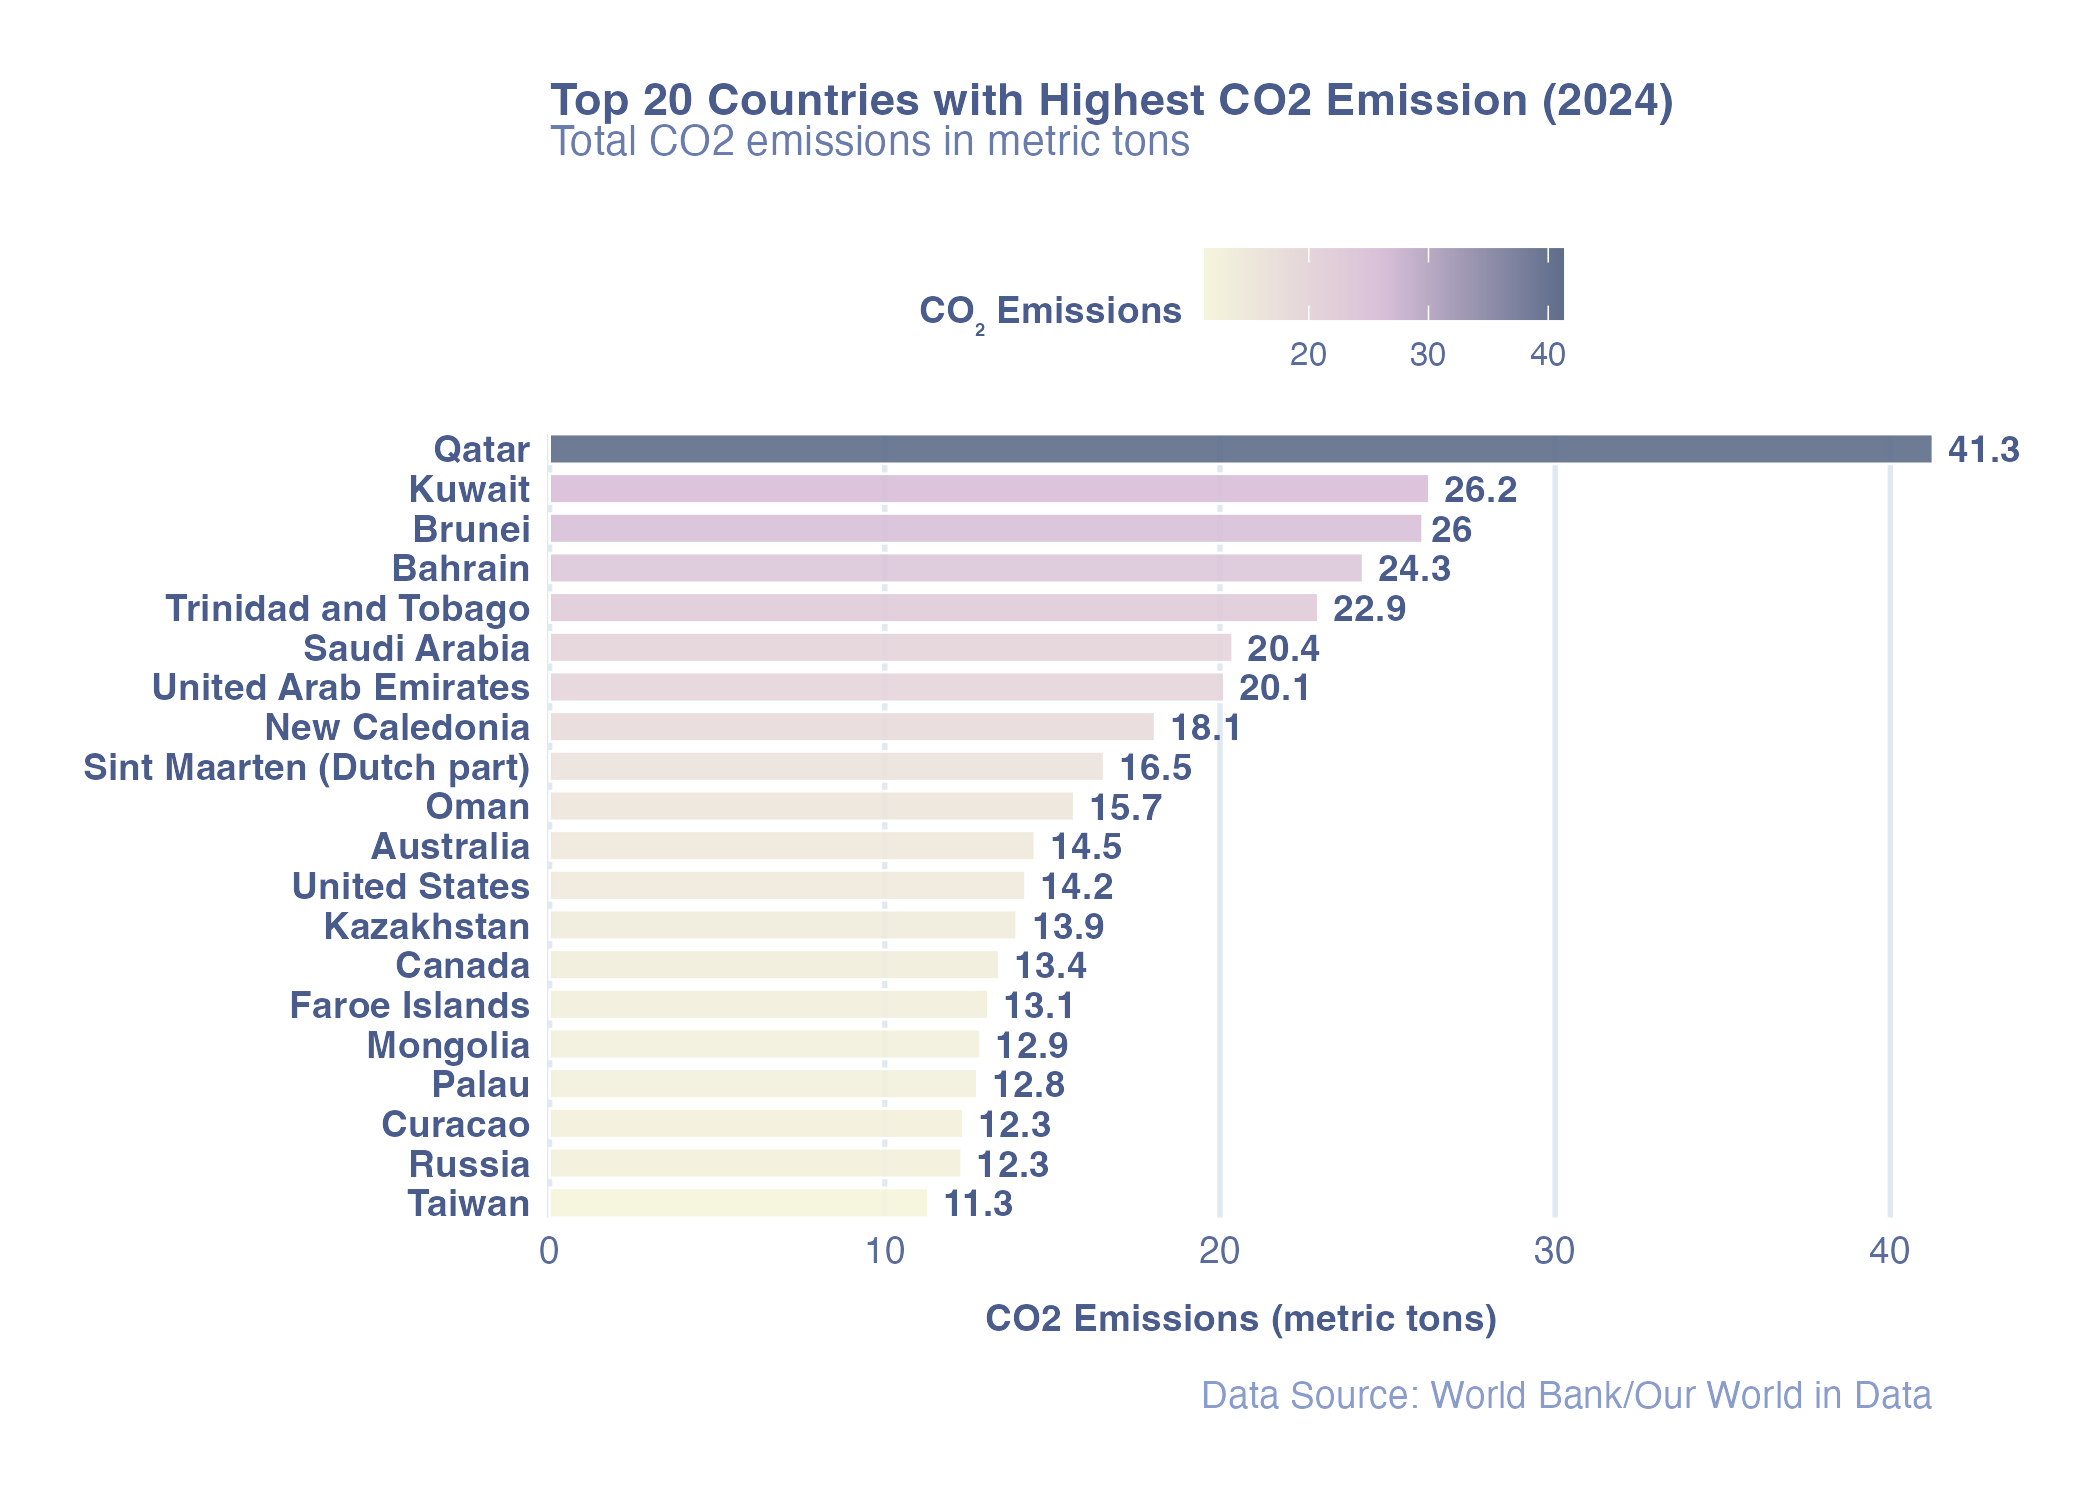
What are the Top20 countries with the greatest CO₂ emissions per capita in the most recent year?
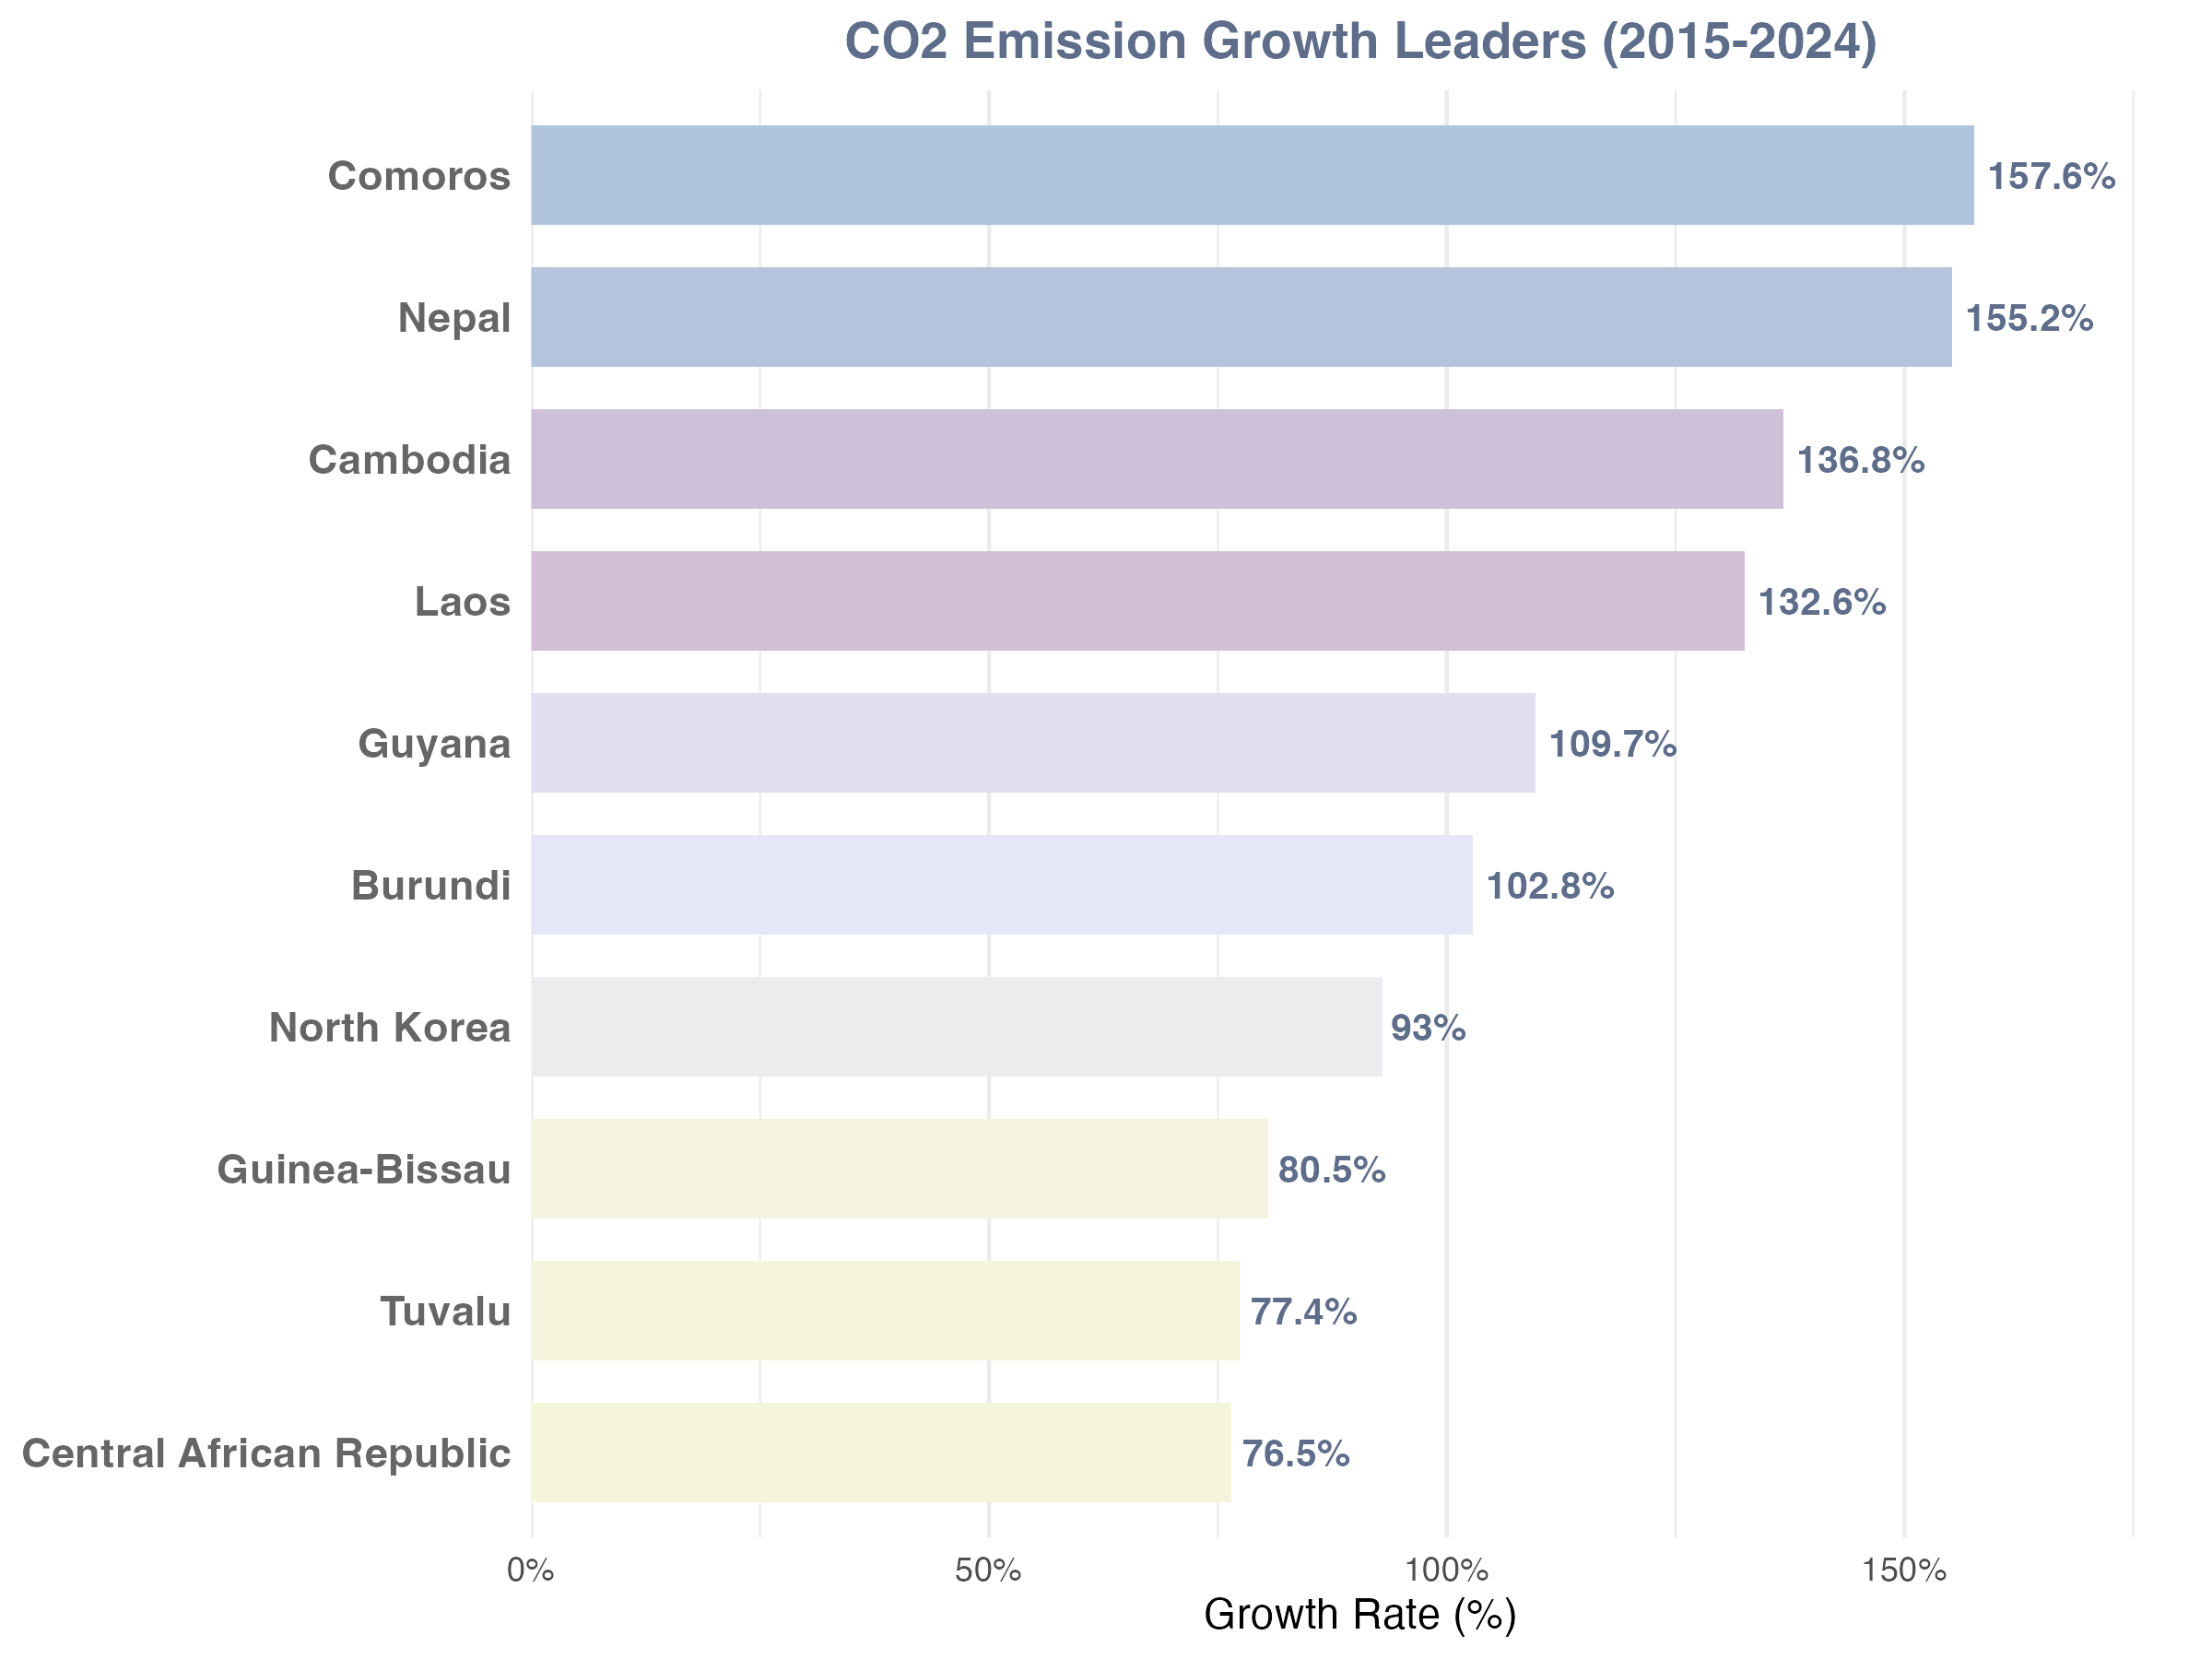
Since the baseline year of the Paris Agreement (2015), which countries have experienced the most significant growth rate in their per capita CO₂ emissions?
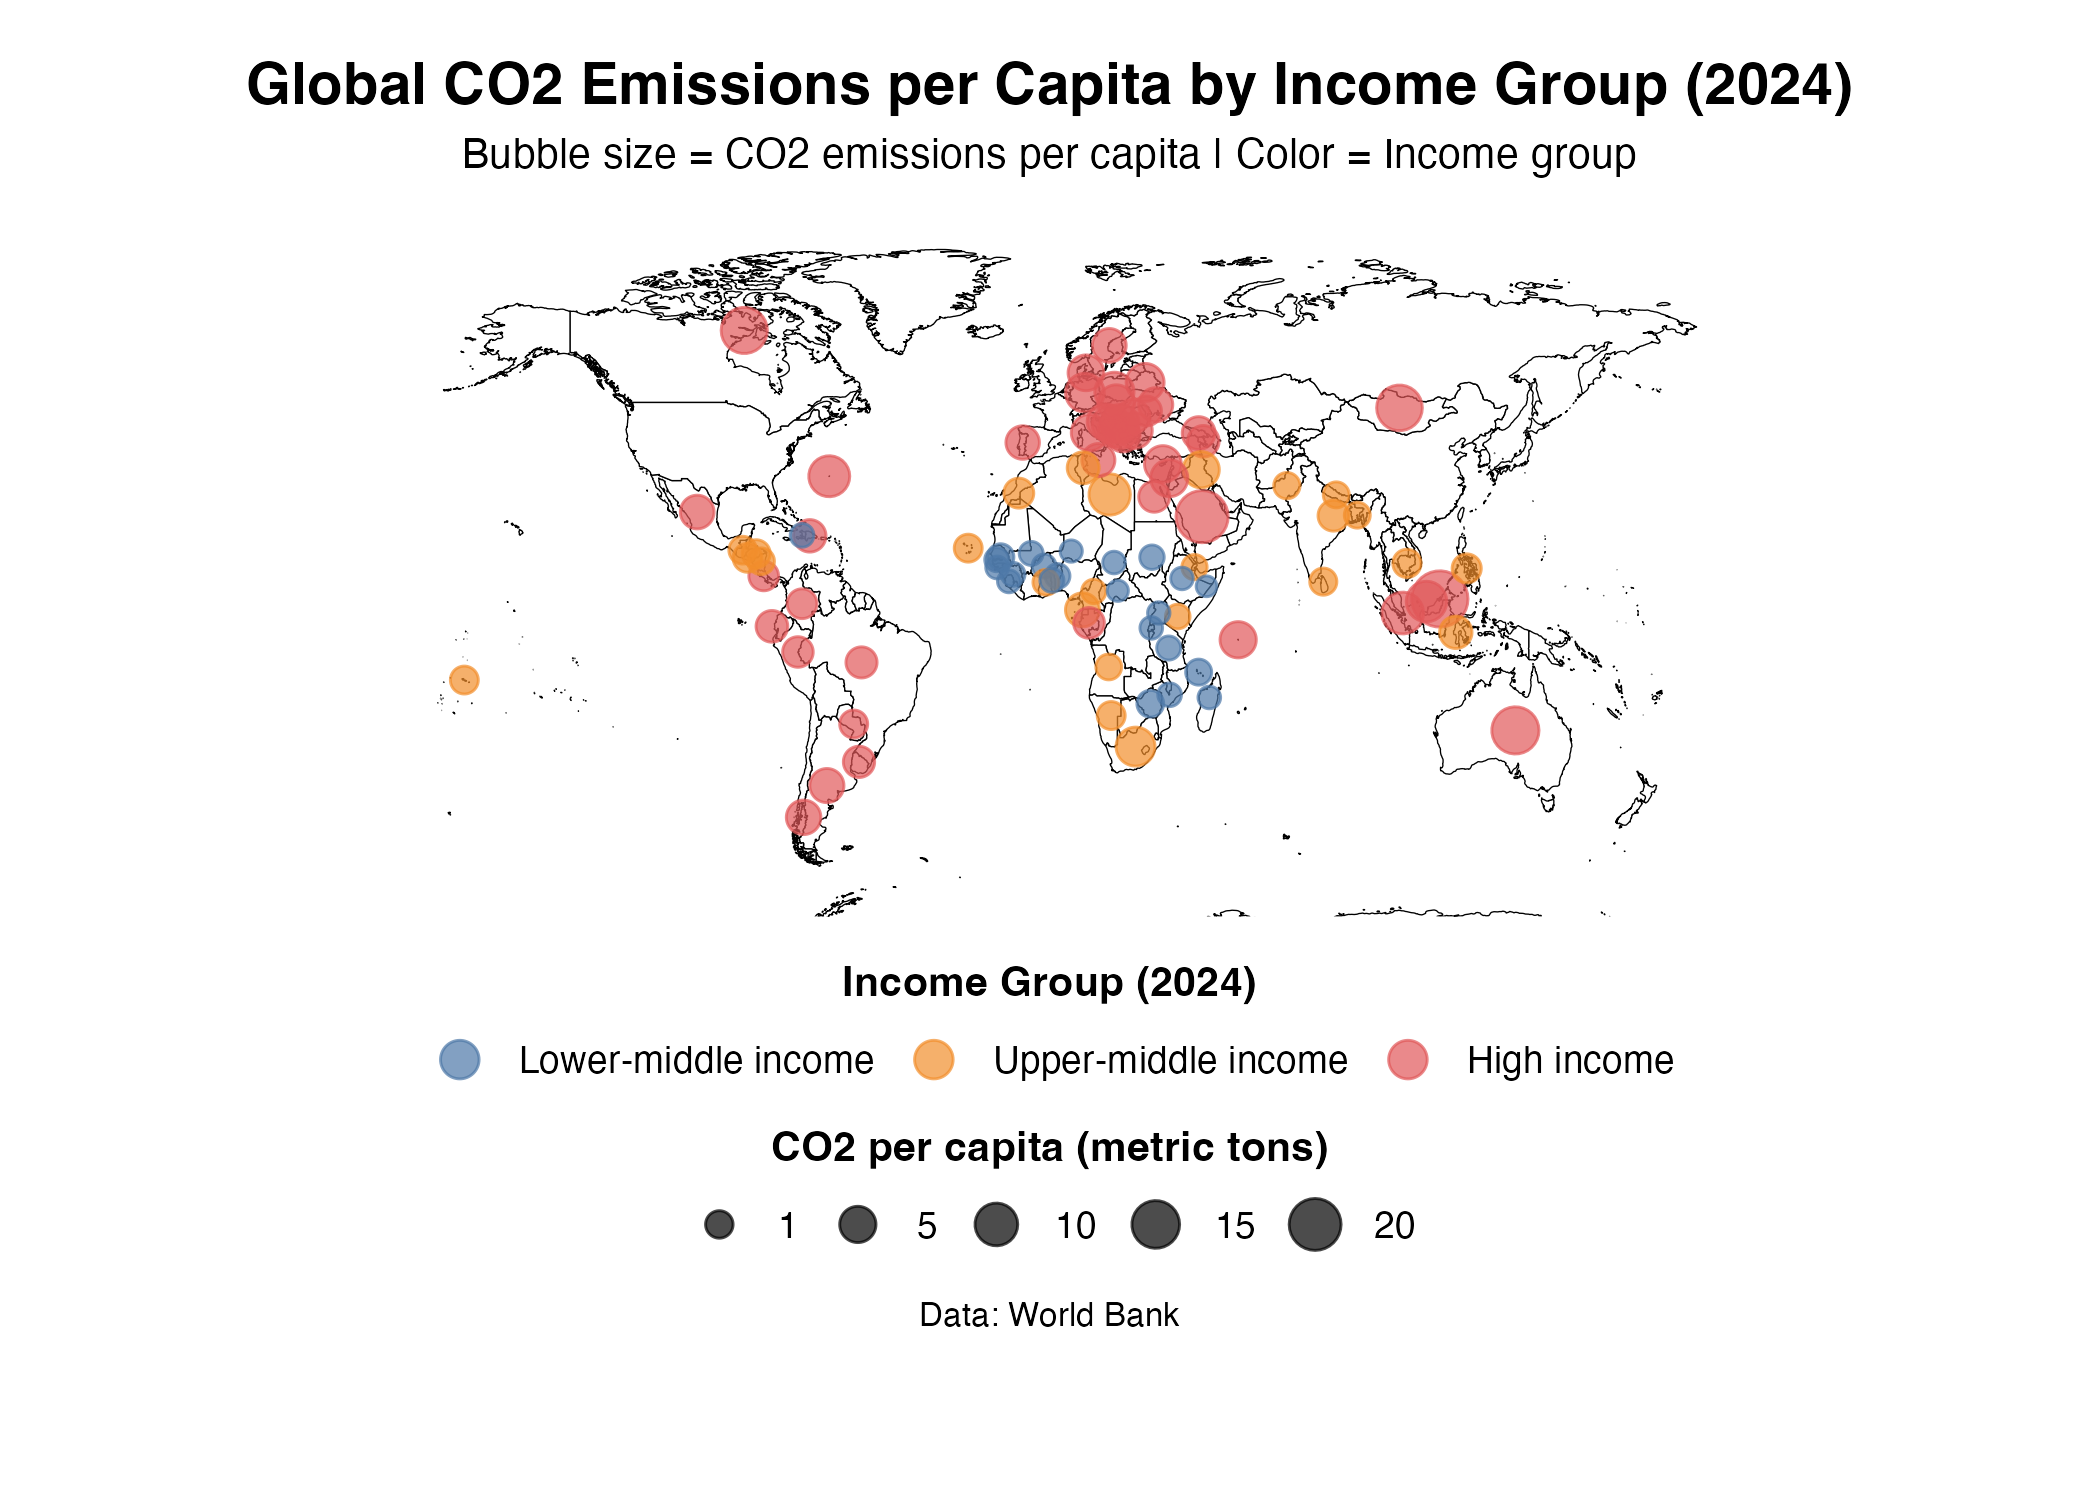
What is the global geographic pattern of per capita CO₂ emissions in 2024, and how does it visually correlate with national income levels on a world map?
Summary of Findings
1. Qatar leads with the highest per capita CO₂ emissions in 2024 among other countries
The top 20 countries with the highest per capita carbon dioxide emissions in 2024 present distinct characteristics. Qatar is far ahead, with a per capita emission of 41.3 metric tons. Most top-ranked countries have resource-intensive economies heavily dependent on the fossil fuel industry, particularly the oil and gas producers of the Gulf region. Kuwait, Brunei, Bahrain, Trinidad and Tobago, and Saudi Arabia follow closely behind, with per capita emissions ranging from 20 to 26 tons, forming the upper echelon of the global carbon footprint.
It is noteworthy that major developed economies such as the United States, Australia, and Canada also on the list. While their per capita emissions are substantially lower than those of the leading fossil-fuel exporters, they remain elevated at 14.2, 14.5, and 13.4 tons respectively. The ranking further includes several small island territories and dependencies with specialized economic profiles, alongside other large economies like Russia and Taiwan. Overall, the outlook for 2024 highlights the extreme concentration of per capita emissions in specific countries (typically resource-rich ones), highlighting the significant differences in carbon intensity across global lifestyles and economic activities.
2. Since the Paris Agreement, which countries have seen the fastest growth in per capita emissions? A list dominated by small developing and emerging economies
Since the signing of the Paris Agreement in 2015, the main goal of this commitment is to limit global warming to well below 2°C, and ideally to 1.5°C, above pre-industrial levels. However, according to data from 2015 to 2024, the top of the growth ranking is almost entirely occupied by developing and emerging economies, many of which started from a very low emissions base. The country with the largest increase is Comoros, with a staggering growth rate of 157.6%. It is closely followed by Nepal (155.2%), Cambodia (136.8%), Laos (132.6%), and Guyana (109.7%). Other nations on the list, such as Burundi, North Korea, and Tuvalu, also exhibit growth rates exceeding 75%.
This trend highlights a key dynamic in global climate efforts: while some developed countries may be reducing or stabilizing their emissions, the carbon footprint of many countries in the early or accelerated stages of economic development is increasing rapidly. This significant percentage increase often stems from a lower starting point, highlighting the challenges faced by fair climate action and the urgent need for a sustainable development path that supports growth without replicating past high-emission models.
3. A clear correlation between income and carbon Footprint: high-Income nations’ per capita emissions far exceed the rest of the world
The 2024 global geographic pattern of per capita CO₂ emissions reveals a strong, positive correlation with national income levels. According to the 2025 national income classification standard from World Bank, and combine with the available data from 100 countries worldwide, it clearly shows a stark divide across income groups.
High income countries, representing the smallest number of nations but the highest average Gross National Income (GNI) at approximately $38,589, exhibit a significantly larger average per capita carbon footprint of 5.81 metric tons. This is over three times the average of upper middle income countries (1.86 tons) and more than twenty times that of lower middle income countries (0.27 tons). The substantial disparity, further emphasized by the median values, illustrates a global landscape where economic prosperity is intrinsically linked to higher levels of carbon-intensive energy consumption and lifestyle. This pattern explain the central challenge of climate equity: the nations with the greatest historical responsibility and current capacity to lead the transition often remain the largest per capita emitters, while lower income nations, despite having minimal historical contributions, face the dual pressures of pursuing development and adapting to climate impacts.